DLHS or NFHS: choosing data for district health analysis
The hardest part of district health analysis in India is often not finding a number. It is deciding whether two numbers are genuinely comparable.
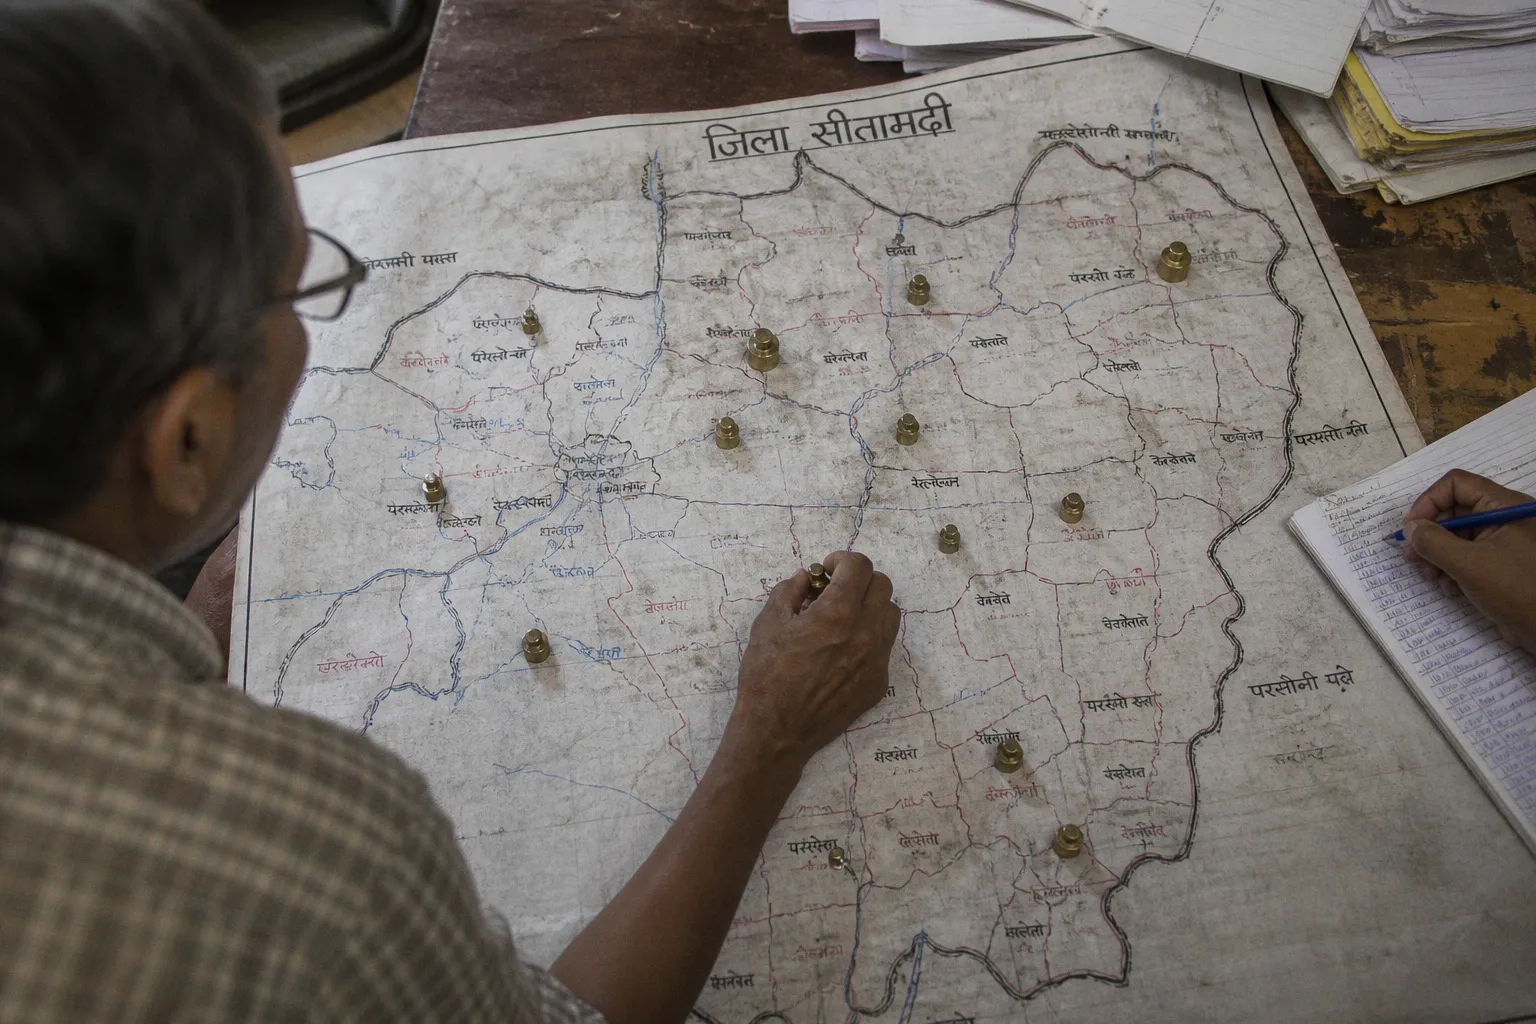
A district may appear to have improved contraceptive use, institutional delivery, antenatal care, or child immunisation between two survey rounds. But before interpreting that change, I want to know what kind of survey produced each estimate, which population was sampled, how the district was defined at the time, and whether the indicator was measured in the same way. A comparison between DLHS indicators and NFHS district-level data can look precise while quietly combining different geographies, questionnaires, and sampling designs.
Compare car rental deals in United Kingdom
See available offersPartner link — DiscoverCars comparisonFor practitioners working with reproductive and child health data, this is not a minor technical concern. The choice between the District Level Household Survey and the National Family Health Survey shapes what can be said about access to care, unmet need, fertility, maternal services, and child health on the ground.
The short history behind the two survey systems
DLHS and NFHS are often placed side by side as if they were competing surveys with identical purposes. They were not.
The District Level Household Survey was built specifically to generate district-level information on reproductive and child health. Its four completed rounds were:
- DLHS-1, 1998–99
- DLHS-2, 2002–04
- DLHS-3, 2007–08
- DLHS-4, 2012–13
The survey was coordinated by the International Institute for Population Sciences in Mumbai under the stewardship of the Ministry of Health and Family Welfare. Its central value was practical: national and state averages could not show whether services were reaching individual districts, particularly districts with weaker health infrastructure or difficult geographic access.
The National Family Health Survey followed a somewhat different path. The first three rounds—NFHS-1 in 1992–93, NFHS-2 in 1998–99, and NFHS-3 in 2005–06—were designed primarily to provide representative estimates at national and state levels. They did not provide district-level estimates in the way NFHS does today.
That changed with NFHS-4 in 2015–16. The sample expanded to 601,509 households, allowing the survey to generate district-level estimates for all 640 districts covered in that round. NFHS-5, conducted in 2019–21, extended district-level coverage to 707 districts, based on the district structure as of March 31, 2017.
This expansion changed the data landscape. Instead of maintaining separate large-scale district survey systems, the expanded NFHS framework absorbed standalone district surveys such as DLHS and the Annual Health Survey. The result was a more integrated national survey architecture, but it also created a period in which analysts must work across older DLHS datasets and newer NFHS datasets with care.
The question is not simply whether DLHS or NFHS is the better survey. The useful question is which survey is better suited to the decision you are trying to make.
What DLHS was designed to see
DLHS was especially valuable for the operational side of reproductive and child health. It asked questions that connected household experience with the availability and use of services: antenatal care, delivery care, contraception, immunisation, reproductive health needs, and selected facility-level conditions.
The women’s module focused on women aged 15–49 who had ever been married. In DLHS-3, the design also included unmarried women aged 15–24 in the relevant module. That distinction matters because a measure based on ever-married women cannot automatically be treated as a measure for all women of reproductive age.
DLHS-3 is often used in district comparisons because it covered 601 districts and 720,320 households. Its scale made it possible to look beyond state averages and ask more grounded questions:
- Was a woman receiving antenatal care in one district but not another?
- Did institutional delivery rise where public facilities had been strengthened?
- Were contraceptive choices changing across rural and urban populations?
- Which districts reported low levels of child immunisation or postnatal care?
- Were health-service gaps concentrated in particular regions or social groups?
Those questions remain clinically meaningful. A district-level rate is never the whole care pathway, but it can identify where the pathway is breaking down.
For example, a low institutional delivery figure may point toward distance, cost, transport, facility confidence, household decision-making, or the availability of skilled staff. DLHS can help identify the distribution of the problem. It cannot, by itself, explain every reason behind it. That is where qualitative research, facility assessments, and local programme data become necessary.
The strength of DLHS: district-level service visibility
DLHS is often the more natural starting point when the analysis is historical and focused on RCH programme implementation. It was designed around district planning, so its indicators fit the questions that state health departments and district programme managers were asking at the time.
Its value is particularly strong when:
- the study period falls before NFHS-4;
- the analysis needs to track changes across the DLHS rounds;
- the outcome concerns maternal or child health service use;
- the researcher is examining district disparities in the 2000s;
- local programme implementation is being assessed in its historical context.
DLHS also provides a useful counterweight to national narratives. A state can show overall improvement while several districts remain behind. Conversely, a district can improve quickly from a low baseline without reaching the state average. Looking only at the state level can hide both patterns.
What NFHS adds to district analysis
NFHS has a broader population-health lens. Alongside reproductive, maternal, and child health indicators, it includes information on fertility, family planning, nutrition, child anthropometry, household conditions, women’s and men’s health, and selected aspects of service coverage.
The move to district-level estimates in NFHS-4 was a major methodological and practical development. The sample grew more than fivefold compared with NFHS-3: from 109,041 households in NFHS-3 to 601,509 households in NFHS-4. This was not merely a larger version of the same exercise. It expanded the level at which health and demographic patterns could be observed.
NFHS-4 made it possible to ask questions such as:
- How did fertility and family planning vary between districts within the same state?
- Were child nutrition outcomes associated with household living conditions?
- Did maternal care coverage improve in districts with different levels of institutional capacity?
- How did rural and urban populations differ within a district?
- Were social inequalities visible even when the district average appeared favourable?
NFHS-5 continued this district-level approach and covered 707 districts. It offers the most current of the two major district-level survey frameworks in the factual base available here, although “current” does not mean that every estimate can be compared directly with every earlier round.
NFHS is usually preferable when the analysis requires a combined view of population dynamics, health, and nutrition. It is also the stronger choice for work that needs to connect reproductive health indicators with broader demographic and household characteristics.
The strength of NFHS: a wider analytical frame
The district level of NFHS is particularly useful for analyses that move between service use and population outcomes. Fertility, contraceptive prevalence, child nutrition, maternal care, and household conditions can be examined within a common survey architecture.
That wider frame helps prevent a common analytical mistake: treating service coverage as the same thing as health outcome. A district may report high antenatal care contact but still experience poor maternal or neonatal outcomes if the quality, timing, continuity, or referral component of care is weak.
Similarly, a district may have a relatively low total fertility rate without equitable access to contraception. Fertility patterns can reflect age at marriage, education, desired family size, method mix, method discontinuation, and the ability to negotiate reproductive decisions. NFHS does not remove the need for interpretation, but it gives the analyst more variables with which to interpret the pattern.
DLHS indicators vs NFHS district-level data
The most useful comparison is not a simple ranking of survey quality. It is a comparison of what each system can support.
| Analytical question | DLHS | NFHS district-level data |
|---|---|---|
| Main historical purpose | District-level reproductive and child health monitoring | Integrated population, health, nutrition, and demographic analysis |
| District estimates available | Designed around district estimates in its completed rounds | Available from NFHS-4 onward |
| Key period | Particularly useful for the late 1990s through 2012–13 | Particularly useful for 2015–16 and 2019–21 district analysis |
| Maternal and child health | Strong focus on service use and RCH indicators | Broad coverage of maternal, child, nutrition, and household indicators |
| Fertility and population analysis | Available for selected reproductive health questions | Stronger fit for fertility, family planning, and wider demographic analysis |
| Historical continuity | Four DLHS rounds, with differences between rounds | NFHS-4 and NFHS-5 offer the modern district-level series |
| Main limitation | Older framework and possible difficulty aligning districts over time | District boundaries, questionnaire changes, and comparability across rounds |
| Best use | Historical district programme analysis | Current district profiling and integrated health analysis |
In practice, I would use DLHS when the research question begins with the history of district RCH performance. I would use NFHS when the question needs a contemporary district profile or links maternal and child health with fertility, nutrition, and household characteristics.
The two systems can be used together, but not as if they were two columns in a perfectly stable spreadsheet.
The geography problem is not a footnote
Districts are administrative units, not permanent natural features. They can be divided, renamed, merged, or reorganised. This creates one of the most serious risks in comparing DLHS with NFHS.
DLHS-3 covered 601 districts. NFHS-4 covered 640, and NFHS-5 covered 707. The increase does not necessarily mean that the health system suddenly changed in a way that produced more districts. It reflects changes in administrative geography as well as expanded survey coverage.
Suppose a historical district was divided into two newer districts. A DLHS estimate for the older unit may represent a population that is now distributed across both NFHS districts. Comparing the older number with either new district can produce a false impression of improvement or decline. The problem becomes even more difficult when district boundaries changed but the names remained similar.
For a district trend analysis, I would therefore begin with a geography file rather than a chart. The analyst needs to establish:
1. Which district boundaries were used in each survey round.
2. Whether the district name refers to the same administrative territory.
3. Whether a newer district was carved out of an older one.
4. Whether the survey documentation provides a concordance between the geographies.
5. Whether the comparison should be made at a higher, more stable level such as the state or region.
If boundary alignment cannot be demonstrated, the responsible conclusion may be that the estimates are descriptive of their respective survey geographies but do not support a clean district-level trend.
This is one of those moments when a less ambitious analysis is often the more credible one. A state-level comparison with stable definitions can be more informative than a district ranking built on mismatched boundaries.
A district name is not automatically a consistent study population. Before comparing the percentage, compare the map.
Why similar indicators may still measure different things
Even when the district boundaries match, the indicator definitions may not.
Maternal health measures can depend on the reference period, the denominator, and the wording of the question. “Antenatal care” may refer to receiving at least one contact, while another analysis may require four or more visits, a specific timing of the first visit, or a set of services during pregnancy. “Institutional delivery” can describe place of delivery, but it does not tell us whether the woman received respectful, timely, and clinically appropriate care.
Contraceptive prevalence also needs careful handling. The estimate may be based on currently married women, all women in a specified age range, or another defined population. A comparison of modern method use can become misleading if one round or report uses a different denominator or treats methods differently.
For child health, immunisation indicators can be affected by whether the estimate is based on the vaccination card, maternal recall, or a combined approach. Nutrition indicators require attention to the child’s age range, the anthropometric standard used, and whether the data are being interpreted as prevalence or as a continuous distribution.
The practical reading sequence should be:
- identify the exact indicator label;
- read the numerator and denominator;
- check the age, sex, and marital-status restrictions;
- confirm the reference period;
- examine whether the measure is self-reported, observed, or based on a record;
- review whether the questionnaire or coding changed between rounds;
- only then place the estimates beside one another.
This may sound slow, but it is faster than explaining a confident conclusion that later turns out to be based on two different definitions.
Reading the RCH data indicators in context
District-level health indicators are most useful when they are treated as signals within a care pathway.
Take antenatal care. A district may have a reasonable proportion of women reporting contact with a provider, but the timing of that contact, the number of visits, blood pressure monitoring, testing, counselling, and referral readiness may vary considerably. A single coverage indicator can identify a gap, but it cannot describe the entire quality of care.
The same applies to delivery care. An increase in institutional delivery is an important change, but it should be read alongside the availability of skilled personnel, emergency referral systems, transport, and postnatal follow-up. From the patient’s perspective, the pathway does not end at the facility door.
This is where the difference between population analytics and clinical care becomes especially important. Survey data show patterns across populations. They do not replace case records, maternal death reviews, facility audits, or conversations with women and families. On the ground, a district average may conceal a serious problem among remote communities, adolescents, migrants, or socially marginalised groups.
When I use district data in clinical or programme discussions, I try to ask three linked questions:
1. What is the observed level of coverage or outcome?
2. Which population may be hidden inside the average?
3. What point in the care pathway could plausibly produce this pattern?
The third question should remain a hypothesis, not a claim of causation. Survey data can show that two conditions occur together. They do not automatically show that one caused the other.
Choosing the right survey for the job
A useful selection decision can be made by starting with the time period and then narrowing the question.
Choose DLHS when the historical district programme is the subject
DLHS is the appropriate anchor for work examining district-level RCH performance before the expansion of NFHS. It is especially relevant to studies of service delivery and reproductive health in the period covered by DLHS-1 through DLHS-4.
For example, a researcher studying how district maternal health indicators changed between the late 1990s and 2012–13 may find DLHS more coherent than attempting to insert earlier NFHS rounds into the analysis. The first three NFHS rounds were not designed to provide representative district-level estimates, so they should not be treated as earlier district baselines.
DLHS can also help reconstruct the policy environment in which district health planning developed. Its figures may be older, but older does not mean irrelevant when the question is historical implementation.
Choose NFHS when the analysis needs a modern district profile
NFHS-4 and NFHS-5 are the natural foundation for contemporary district-level analysis. They provide a broader set of population, health, and nutrition indicators and allow researchers to explore relationships that a narrower RCH dataset may not support.
If the question concerns current district inequalities in fertility, family planning, maternal care, child nutrition, or household conditions, NFHS is generally the stronger starting point. It is also better suited to building a multidimensional district profile rather than examining one programme indicator in isolation.
Use both when the transition itself matters
There are studies for which the most important story lies between the survey systems: how district health conditions changed from the DLHS era to the NFHS district era.
That kind of analysis can be valuable, but it needs a declared method. The researcher should not simply label DLHS-3 as “2007” and NFHS-4 as “2016,” calculate a difference, and call it progress. The comparison must explain:
- how district boundaries were aligned;
- whether the indicator definitions were harmonised;
- whether the target population was the same;
- whether the sampling and weighting procedures affect interpretation;
- whether a difference may reflect survey design rather than a true population change.
If these conditions cannot be met, the analysis can still present the two sources as complementary evidence, but it should avoid claiming a precise trend for individual districts.
A practical workflow for analysis
When a clinician, programme team, or researcher asks me to compare district estimates, I usually work through the data in stages rather than beginning with the most attractive chart.
1. Define the decision behind the analysis
Is the purpose to allocate outreach resources, evaluate a historical programme, describe demographic change, or identify districts for further investigation? A dataset suitable for one purpose may be poorly suited to another.
A district health officer planning maternal outreach needs a different level of detail from a researcher studying fertility transitions. Both may use NFHS, but they will read the indicators differently.
2. Fix the unit of analysis
Decide whether the unit is the district, state, region, rural area, urban area, or a population subgroup. Do not move between these levels without stating why.
An all-district average is not an adequate substitute for a district estimate, and a district average is not a substitute for subgroup analysis.
3. Build an indicator dictionary
For each measure, record the exact definition, denominator, age range, reference period, and survey round. This is especially important for:
- contraceptive prevalence;
- unmet need for family planning;
- antenatal care;
- institutional and skilled birth attendance;
- postnatal care;
- immunisation;
- fertility measures;
- child stunting, wasting, and underweight.
A small dictionary prevents a large amount of confusion later.
4. Align the geography before calculating change
Map historical districts to the districts used in the newer survey, documenting splits and exclusions. If the alignment is uncertain, label the comparison as non-equivalent rather than concealing the uncertainty in a precise-looking percentage.
5. Check the sample and uncertainty
District-level estimates are useful, but they are not measurements without error. Small subgroup estimates can be particularly unstable. A district value should be interpreted with its sampling uncertainty where the available tables or microdata allow it.
A small difference between two rounds may not represent a meaningful change. A large difference deserves investigation, but even then the analyst should rule out definitional and geographic explanations before offering a programme conclusion.
6. Interpret the result alongside service reality
Survey data can identify where to look. Facility records, stock availability, staffing, referral data, community health worker reports, and local qualitative evidence can help explain what is happening.
This is the point at which data becomes a care pathway rather than a ranking. The aim is not to label a district as good or bad. The aim is to understand which women and children are being reached, who is being missed, and where the system can respond.
Common analytical traps
Several errors recur in district health comparisons, and most are avoidable.
Treating early NFHS rounds as district datasets. NFHS-1, NFHS-2, and NFHS-3 provided national- and state-level estimates, not the district-level estimates introduced with NFHS-4.
Assuming that more districts means a larger improvement in coverage. The increase from 601 districts in DLHS-3 to 640 in NFHS-4 and 707 in NFHS-5 reflects survey expansion and administrative changes, not a health outcome.
Comparing district names without checking boundaries. The same name may refer to a different territorial unit across rounds, while a new name may represent only part of an older district.
Using a service indicator as a quality indicator. Contact with a facility is not the same as complete, safe, respectful, or continuous care.
Ignoring the denominator. A percentage can change because the target population changed, even when the underlying service pattern did not.
Ranking districts without considering uncertainty. A league table encourages readers to overinterpret small differences and can stigmatise communities that are already underserved.
Reading correlation as causation. A district with higher education and better maternal care may also have lower fertility, but survey data alone cannot establish which mechanism drove the association.
Treating DLHS and NFHS as interchangeable. They overlap in subject matter, but their purposes, timing, coverage, and survey architecture are not identical.
The role of IIPS Mumbai reports and supporting data
The International Institute for Population Sciences is central to both survey series, which makes its documentation especially important for analysts working across rounds. The reports and technical materials are not background reading to be consulted after the table has been made. They are part of the data.
For a defensible comparison, the analyst should examine the survey report, questionnaire, sampling notes, district tables, and available documentation on definitions and weighting. A headline indicator without its technical context is an incomplete piece of evidence.
It is also useful to place survey results beside other data systems, provided the differences are made explicit. Census data, civil registration, health management information systems, facility assessments, and epidemiological studies each describe different aspects of the population and health system. They should not be forced into a single composite number simply because they concern the same district.
A survey may capture care-seeking behaviour and household experience. Routine data may capture service contacts recorded by the health system. Census data may provide a more stable population denominator but at a different time interval. These sources can illuminate one another, but they do not become interchangeable through repetition.
What this means for practitioners and patients
For practitioners, district-level data can guide attention, but it should not determine how an individual patient is treated. A district with low antenatal care coverage may need stronger outreach, transport support, and continuity of midwifery care. That does not mean every woman from the district has the same needs.
Likewise, a district with high contraceptive prevalence may still contain women who cannot obtain their preferred method, experience side effects without support, or face pressure from partners or relatives. Population statistics should open the conversation about access and rights, not close it with an assumption about what patients want.
This is particularly important in reproductive health, where the same indicator can conceal very different experiences. A rise in contraceptive use is not automatically evidence of reproductive autonomy. A fall in fertility is not automatically evidence of improved wellbeing. A high institutional delivery rate does not guarantee respectful maternity care.
The most humane use of survey data is to make invisible gaps easier to see while preserving the dignity and choices of the people behind the estimates.
Final position: use the survey as a route map, not a verdict
DLHS remains indispensable for understanding the history of district-level reproductive and child health measurement in India. Its four rounds were designed to bring district disparities into view, particularly during the period before NFHS adopted a much larger district-level sample.
NFHS-4 and NFHS-5 provide the stronger modern framework for district analysis, with broader coverage of population, health, nutrition, and demographic indicators. Their scale makes them valuable for current district profiling and for examining how reproductive health sits within wider social and household conditions.
The best choice depends on the question:
- Use DLHS for historical district RCH analysis and programme tracking across its completed rounds.
- Use NFHS-4 or NFHS-5 for contemporary district-level health, nutrition, fertility, and population analysis.
- Use both only after aligning definitions, survey periods, boundaries, and uncertainty.
- Use supporting administrative and qualitative evidence to explain the pattern rather than treating the survey estimate as an explanation in itself.
In district health work, a number is not the destination. It is a signpost. The responsible analyst follows it back to the population, the service, and the care pathway—and remains honest about what the data can, and cannot, show.