DLHS versus NFHS data for district fertility analysis
A district fertility estimate can look deceptively precise: one number, one district name, perhaps a neat comparison across survey rounds.
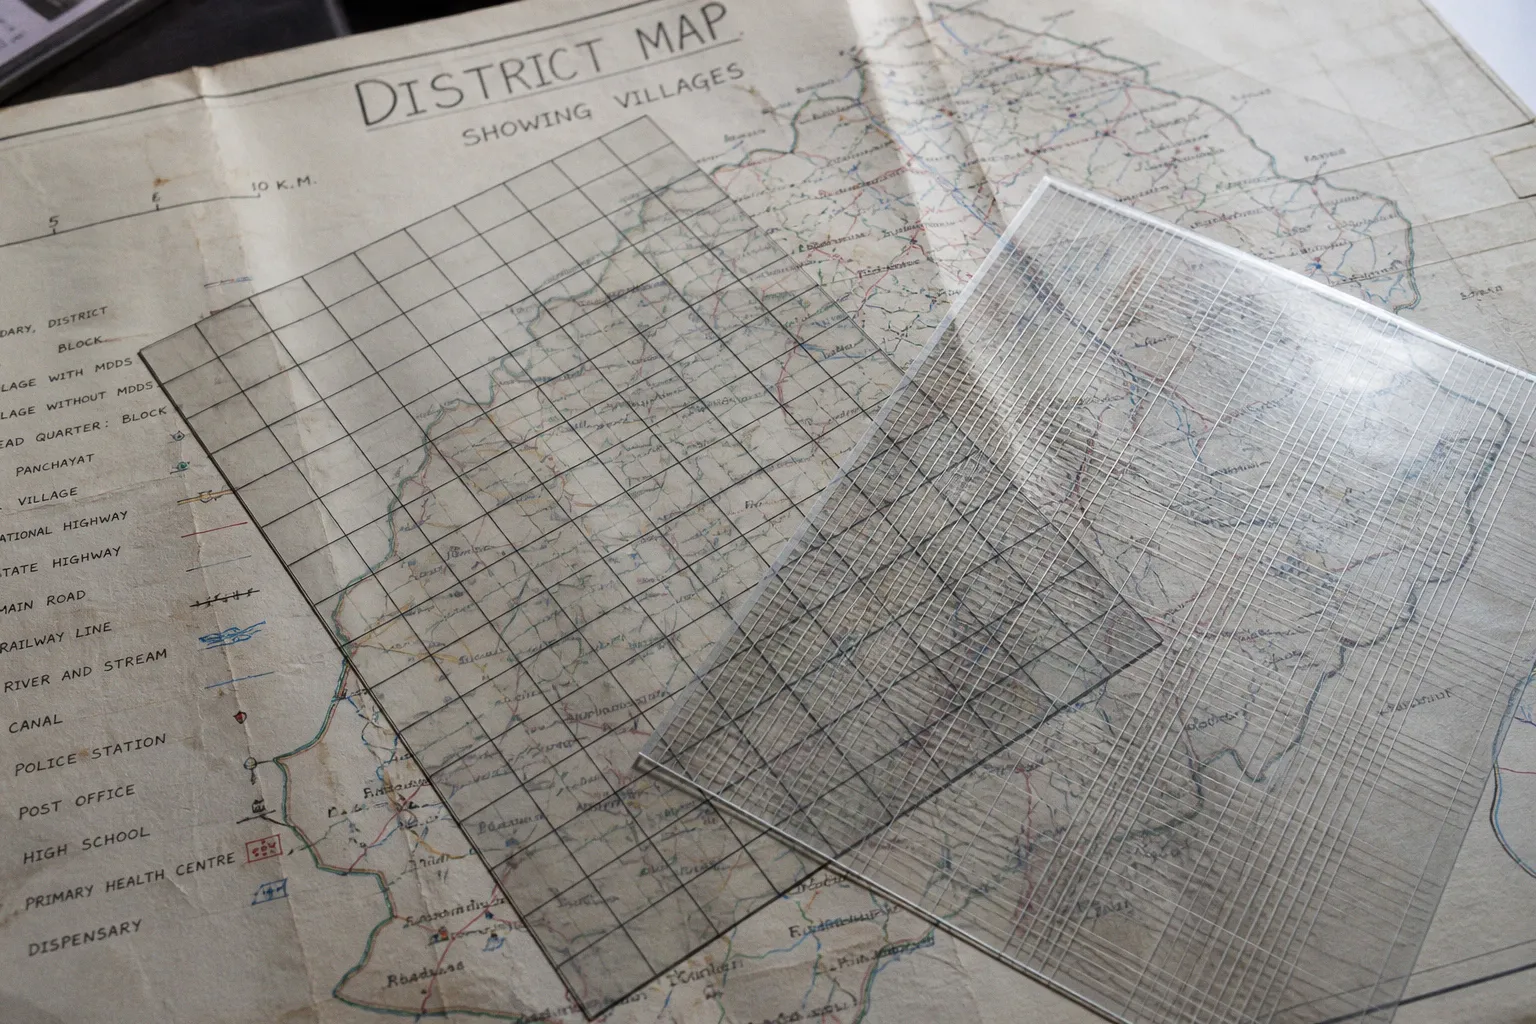
But when I work with reproductive-health data, the first question is rarely “Which district has the higher total fertility rate?” It is “Are these two numbers describing the same population, the same geography, and the same period of reproductive experience?”
Compare car rental deals in United Kingdom
See available offersPartner link — DiscoverCars comparisonThat distinction matters when comparing the District Level Household Survey (DLHS) with the National Family Health Survey (NFHS). Both are central sources for understanding fertility, family planning, maternal health, and reproductive care in India, yet they were built for different survey systems and different moments in the country’s demographic history. Their district figures are not automatically interchangeable, even when the indicator has the same familiar name.
For anyone asking how to check DLHS versus NFHS data for district fertility analysis, the practical route is to begin with the survey architecture—not with the spreadsheet. Confirm the round, respondent universe, fertility definition, reference period, district boundary, and uncertainty around the estimate before interpreting a change.
The two survey systems answer related, but different, questions
DLHS was designed around district-level reproductive and child-health information. Its four rounds were conducted over a long period of change:
- DLHS-1: 1998–99
- DLHS-2: 2002–04
- DLHS-3: 2007–08
- DLHS-4: 2012–13
This sequence gives researchers an important view of how maternal care, contraception, fertility preferences, and child-health services varied below the state level. DLHS-3, in particular, was designed to produce district estimates for maternal and child health, family planning, and reproductive-health indicators. The project description refers to approximately 700,000 households across 612 districts, while another account reports completed data collection for 601 districts in 34 States and Union Territories. Those figures should not be flattened into one apparently exact coverage number; they describe different aspects of the survey’s reported scope.
NFHS developed as a broader national health and demographic survey, with district estimates becoming increasingly important in later rounds. NFHS-4 was designed around the 640 districts existing at the time of the 2011 Census. NFHS-5, conducted in 2019–21, covered 707 districts, including districts created after the 2011 Census framework.
That expansion makes NFHS-5 especially valuable for current district-level planning, but it also creates a comparability issue. A district in NFHS-5 may not represent the same territorial unit as a district with the same name in DLHS-3 or NFHS-4.
A district label is not a stable unit of analysis unless its boundary and reference framework have also been checked.
The surveys therefore overlap in subject matter without being identical instruments. DLHS offers a historically important district-focused series, particularly for reproductive and child-health service indicators. NFHS offers a more recent and nationally harmonised framework with extensive demographic, health, and household information. The better source depends on the question being asked.
If the study concerns long-term district-level access to antenatal care or contraceptive use, DLHS may provide an essential earlier observation. If the study needs recent fertility preferences, household conditions, or comparisons across the expanded post-2011 district system, NFHS-5 may be more suitable. Neither dataset should be selected simply because it has the newer publication date or the more familiar brand.
Survey rounds are not interchangeable time points
The first error I often see in analysis is treating DLHS-3, NFHS-4, and NFHS-5 as if they were evenly spaced observations in one continuous district fertility panel. They are not.
The fieldwork periods differ, as do the fertility reference periods used in reporting. NFHS fertility rates are generally reported for the three years preceding the survey. NFHS-4 was conducted in 2015–16, and its national total fertility rate for the preceding three-year period was reported as 2.18 children per woman. NFHS-5 was conducted in 2019–21, with a national total fertility rate of 2.0. In the Ministry of Health and Family Welfare’s comparative reporting, the corresponding rounded NFHS-4 figure appears as 2.2.
That difference between 2.18 and 2.2 is not a substantive demographic disagreement. It is a reminder to preserve the precision and presentation used by the source rather than manufacture a new level of exactness.
Earlier NFHS figures show the national direction of fertility change: 2.68 in NFHS-3, 2.18 in NFHS-4, and 2.0 in NFHS-5, with the fertility reference period tied to the three years before each survey. These national numbers are useful context, but they cannot substitute for district estimates. A state-level or national total fertility rate should never be inserted into a district analysis merely because the district figure is difficult to locate.
DLHS rounds also represent different periods and survey designs. A value from DLHS-3, collected in 2007–08, is not a direct measurement of the same period represented by NFHS-5. Even when the underlying population has changed gradually, the interval includes shifts in education, marriage timing, migration, service access, contraception, household composition, and district administration.
A responsible comparison begins with a time table such as this:
| Survey | Fieldwork period | Geographic framework | Analytical caution |
|---|---|---|---|
| DLHS-1 | 1998–99 | Earlier district structure | Historical baseline; district boundaries may not match later rounds |
| DLHS-2 | 2002–04 | Earlier district structure | Time interval is not identical across districts or indicators |
| DLHS-3 | 2007–08 | District-focused design using 2001 Census information for sampling | Strong district-health relevance, but respondent coverage differs from earlier DLHS rounds |
| DLHS-4 | 2012–13 | Later district and survey framework | Exact indicator comparability should be confirmed from the relevant documentation |
| NFHS-4 | 2015–16 | 640 districts existing at the time of the 2011 Census | District estimates belong to the NFHS-4 geography and definitions |
| NFHS-5 | 2019–21 | 707 districts, including post-2011 districts | More recent, but not an unchanged continuation of the NFHS-4 district series |
The dates should be placed beside every extracted value in the working file. “Survey year” alone is not enough. Include the fieldwork period, the fertility reference period, the district framework, and the exact table or estimate type. This small discipline prevents many large interpretive errors later.
Respondent coverage changes the meaning of the fertility estimate
DLHS-3 did not use exactly the same respondent universe as the first two DLHS rounds. Earlier rounds interviewed currently married women aged 15–44. DLHS-3 interviewed ever-married women aged 15–49 and never-married women aged 15–24.
That is not a minor wording change. It affects whose reproductive histories, fertility intentions, and experiences are represented in the data.
A fertility measure based on women aged 15–49 cannot be treated as methodologically identical to one based on currently married women aged 15–44. The change broadens the age range and changes marital-status coverage. It may capture experiences that earlier rounds excluded, while also altering the composition of the denominator.
This is particularly important in India, where age at marriage, periods of separation, widowhood, remarriage, and non-marital experiences are not distributed evenly across districts or social groups. A respondent-universe change may therefore affect not only the national estimate but also the pattern of variation between districts.
NFHS fertility analysis also requires close attention to the population included in the published indicator. A total fertility rate is not simply the average number of children reported by every household. It is an estimate constructed from age-specific fertility information and a defined reproductive population and period. The source table, questionnaire, birth-history construction, and weighting approach all matter.
When comparing a DLHS indicator with an NFHS indicator, I would record at least the following:
- the age range of respondents;
- marital-status eligibility;
- whether the estimate comes from a birth history, recent births, or reported children ever born;
- the reference period;
- the geographic population represented;
- the weighting and sample design;
- whether the value is a published fact-sheet estimate or a researcher-generated estimate.
A similar label—“fertility rate,” “total fertility rate,” or “fertility preference”—does not guarantee a similar construction. The analyst needs to read the table title, denominator, footnotes, and technical notes as carefully as the number itself.
The denominator is part of the finding. Change the respondent universe, and you may change what the estimate means.
This is also where patient-centred clinical experience helps me interpret population data. On the ground, a woman’s care pathway is not organised around a single statistical category. A young unmarried woman, a recently married woman, a woman who has experienced a stillbirth, and a woman who has completed her desired family may all encounter the health system differently. Survey instruments decide which of those experiences become visible in the dataset.
Sampling design affects district precision
DLHS-3 used two-stage stratified random sampling in rural areas and three-stage stratified sampling in urban areas. Primary sampling units were selected using information from the 2001 Census. This design supported district-level estimation, but it also means that the observations are clustered and stratified rather than a simple random sample of individuals.
That matters for standard errors and confidence intervals. A district estimate derived from a complex sample should not be treated as though every respondent were independently drawn from the entire district population. Clustering can increase the variance of an estimate. Stratification and weighting also need to be reflected in the analysis.
NFHS follows its own sampling framework and weighting procedures. The fact that NFHS-5 included 636,669 households gives it substantial analytical reach, but a very large national sample does not guarantee equal precision for every district and every fertility indicator. The number of sampled households, eligible respondents, births, and events can vary considerably between districts.
For a district fertility study, the right question is not merely “How many households did the survey include?” It is:
1. How many eligible women contributed to the relevant estimate?
2. How many births or birth intervals underlie the fertility calculation?
3. Was the district designed for direct estimation?
4. Does the available file contain survey weights, strata, and cluster identifiers?
5. Can the variance be estimated using the survey design?
6. Are confidence intervals published or calculable?
A published analysis estimated district-level total fertility rates from NFHS-4 birth histories for the eight Empowered Action Group states and Assam. The analysis presented confidence intervals because standard NFHS-4 fertility tables did not provide district-level fertility estimates for all areas in a directly usable form. Those estimates are valuable, but they should be described accurately: they are estimates generated through a published analysis of NFHS-4 birth histories, not official NFHS table values.
This distinction is not academic. If one researcher downloads a fact-sheet value and another calculates a district rate from microdata, the outputs may differ because of the estimator, reference period, weighting, treatment of missing information, and variance procedure. Both may be defensible, but they are not automatically the same statistic.
For analysts working from microdata, the survey design should be specified before calculating fertility. A basic unweighted mean can be useful for exploratory work, but it is not a final district estimate. The final analysis should use the appropriate weights and account for stratification and clustering. If the number of events is small, report the estimate with an uncertainty interval and explain that the interval may be wide.
District boundaries are part of data cleaning, not an afterthought
The most difficult part of comparing district fertility data is often not fertility. It is geography.
India’s districts have been created, divided, renamed, and reorganised over time. NFHS-4 was designed for 640 districts based on the framework associated with the 2011 Census. NFHS-5 covered 707 districts, including districts created after that census. DLHS rounds were conducted against still earlier district structures, including sampling information drawn from the 2001 Census for DLHS-3.
As a result, matching records by district name is unsafe. The same name may refer to a different territory, and a former district may have been split into several later units. Conversely, several historical units may need to be combined if the research question requires comparison with an older boundary.
A proper geographic crosswalk should identify:
- the district name used in the original survey;
- the state or Union Territory in the original survey;
- the survey round and geographic reference year;
- the corresponding code, where available;
- whether the unit was split, merged, renamed, or reassigned;
- the population or area relationship between old and new boundaries;
- whether a defensible harmonised unit can be constructed.
There is no single authoritative crosswalk established here that harmonises every DLHS district with every NFHS-4 and NFHS-5 boundary. That limitation should be stated plainly in a report. A researcher may construct a crosswalk using official administrative records, spatial boundaries, or population-weighted interpolation, but the method must be documented and its assumptions made visible.
Suppose a district named X appears in DLHS-3 and NFHS-5. Before calculating the difference, we need to know whether:
- the later district retained the full territory of the earlier district;
- part of the earlier district was transferred elsewhere;
- the name was reused after reorganisation;
- the survey file uses a district code that differs from the published label;
- the fertility estimate refers to the same population base.
If the old district became two new districts, there is no honest way to describe the NFHS-5 figure for one successor district as a direct continuation of the DLHS-3 figure unless the geographic transformation has been handled explicitly.
The cleanest options are often one of three:
Compare only stable geographic units
This is the most conservative approach. Restrict the analysis to districts whose boundaries can be shown to be sufficiently comparable across the selected survey rounds. The sample of districts may become smaller, but the interpretation is stronger.
Aggregate newer districts to an older boundary
Where the necessary data and population weights are available, several NFHS-5 districts may be combined to approximate the earlier DLHS geography. This requires care because fertility rates cannot always be averaged arithmetically. The aggregation method should reflect the relevant population and the construction of the rate.
Analyse administrative change as part of the result
District reorganisation is not merely a nuisance. It can be relevant to service delivery, governance, and population planning. A study can present newer districts in their own framework and avoid claiming a historical trend where no harmonised comparison exists.
Indicator harmonisation requires more than matching names
Once geography and respondent coverage have been reviewed, the next task is to establish whether the fertility indicators are substantively comparable.
Total fertility rate is often the headline measure because it expresses the average number of children a woman would have over her reproductive life under a given set of age-specific fertility rates. But district fertility analysis may also involve:
- births in the three years before the survey;
- age-specific fertility rates;
- children ever born;
- median birth interval;
- adolescent childbearing;
- fertility preferences;
- wanted and unwanted fertility;
- contraceptive prevalence;
- unmet need for family planning;
- age at first marriage;
- parity progression.
These measures answer different questions. A decline in total fertility rate does not necessarily mean that every group has equal access to contraception or that the timing of first birth has changed in the same way. Nor does a high fertility preference automatically translate into high observed fertility.
The reference period is especially important. NFHS fertility estimates are generally tied to the three years preceding the survey. A DLHS indicator may use a different period or estimation procedure, and the exact method for every DLHS-3 and DLHS-4 fertility indicator should be confirmed from the relevant technical documentation rather than assumed.
For each variable, create a harmonisation note. It can be brief, but it should answer:
| Question | What to document |
|---|---|
| What is measured? | TFR, age-specific fertility, children ever born, preference, or another indicator |
| Who is included? | Age range, marital status, usual residence, and eligibility rules |
| What period is covered? | Survey date and retrospective reference period |
| What is the geography? | Original district framework and any boundary adjustment |
| How is it estimated? | Published table, fact sheet, or calculation from microdata |
| What uncertainty is available? | Standard error, confidence interval, design-based variance, or none |
| Is it directly comparable? | Yes, with conditions; partially; or no |
This note often reveals that a seemingly simple comparison is better reframed. For example, rather than saying “fertility fell by 0.4 children in District Y,” the analysis may need to say: “The published estimates differ, but the survey rounds use different district frameworks and the available documentation does not establish that the difference is statistically significant.”
That wording is not evasive. It is what protects the reader from mistaking a data artefact for a demographic transition.
What a defensible comparison can and cannot claim
A raw subtraction between two survey values is easy:
NFHS value – DLHS value
The interpretation is not.
The subtraction may be useful as a descriptive starting point, but it does not by itself establish a true increase or decrease in fertility. The two estimates may differ because of:
- actual demographic change;
- different respondent populations;
- different questionnaires;
- different sampling designs;
- different district boundaries;
- different reference periods;
- sampling error;
- non-sampling error;
- missing or inconsistently reported birth histories;
- changes in fieldwork conditions.
District-level estimates are sample estimates, not census counts. They carry uncertainty even when displayed to two decimal places. A value such as 2.37 should not be read as though the district’s underlying fertility level is known to the hundredth of a child per woman.
When confidence intervals are available, use them. If they overlap substantially, avoid presenting a small difference as a confirmed change. Overlap is not the only criterion for significance, and non-overlap is not the only way to assess it, but the broader principle remains: uncertainty must be part of the comparison.
Where confidence intervals are unavailable, the limitation should remain visible. Do not invent them from insufficient information, and do not describe an untested difference as statistically meaningful.
A practical interpretation framework looks like this:
1. Descriptive difference: The two published values are numerically different.
2. Comparable difference: The indicator, respondent universe, reference period, and geography have been harmonised sufficiently for comparison.
3. Statistically supported difference: The uncertainty assessment indicates that the difference is unlikely to be explained by sampling variation alone.
4. Substantive explanation: Additional evidence—service data, census information, qualitative research, or demographic analysis—supports an explanation for the observed pattern.
Only the first claim can be made from subtraction alone. The others require progressively stronger evidence.
For a district fertility report, I would also separate the analysis into two layers. The first is a measurement layer: what did each survey estimate, and how was it estimated? The second is a population-health layer: what might the difference mean for women, families, and care pathways on the ground?
A district with higher fertility may be experiencing limited access to contraception, early marriage, unmet need, poor transport, or a population structure with more women in the reproductive ages. A district with lower fertility may still have substantial reproductive-health needs, including coercion, discontinuation problems, infertility care, or inadequate postpartum counselling. Fertility level alone does not tell us whether reproductive rights are being met.
Choosing between DLHS and NFHS for a district study
The choice is clearer when tied to the purpose of the research.
Use DLHS when the historical district-health context is central
DLHS is particularly useful when the study needs to understand district-level maternal, child, family-planning, or reproductive-health conditions during the period before NFHS became the dominant source for district fact sheets. DLHS-3 can provide important evidence on district variation in a period when India’s health-system and fertility transition were moving rapidly.
It may be the only practical source for a historical baseline in a particular district, especially where the research question concerns service coverage rather than a nationally comparable contemporary fertility series.
But the analyst should not assume that every DLHS round is directly comparable with every other DLHS round. The shift in respondent coverage between the earlier rounds and DLHS-3 is one clear reason to read the documentation before constructing a trend.
Use NFHS when current multidimensional household and health analysis is needed
NFHS-5 offers a recent national framework and broad household-health content, with district estimates across 707 districts. It retained much of the NFHS-4 content to support comparison over time while adding topics including disability, toilet access, death registration, menstrual practices, and abortion-related information. HIV testing was dropped from the NFHS-5 content.
That makes NFHS-5 useful when fertility needs to be interpreted alongside household conditions, reproductive preferences, maternal care, menstrual health, or other social determinants. The newer survey may also align more closely with current programme planning, although its district boundaries must still be treated carefully.
NFHS-4 and NFHS-5 are more naturally paired than DLHS-3 and NFHS-5, but even that comparison is not boundary-free. NFHS-5’s 707-district framework is not an unchanged continuation of NFHS-4’s 640-district framework.
Use both when the study is explicitly historical and methodological
A combined DLHS–NFHS study can be very valuable, but it should be framed as a harmonisation exercise rather than a simple trend chart. The analysis should explain which districts are included, how boundaries were matched, which fertility definitions were retained, and where the evidence is too weak for a direct comparison.
In some cases, the strongest design is to use DLHS for historical service indicators and NFHS for recent fertility and household context, without forcing both surveys into one numerical series. A good study does not need every source to answer every question.
A practical workflow for researchers
When I am reviewing a district-level reproductive-health dataset, I prefer a staged workflow that makes the uncertainty visible from the beginning.
Start with the exact research question
“Has fertility declined?” is too broad. Ask whether the study concerns total fertility, timing of births, adolescent fertility, desired family size, contraceptive need, or access to services. The answer determines which survey variables are relevant.
Lock the geographic unit
Create a district inventory for each survey round. Do not merge records by name alone. Record original names, codes, state or Union Territory, boundary framework, and any known reorganisation.
Record the survey design
For each estimate, identify the sampling stages, strata, clusters, weights, and respondent eligibility rules. If you are using microdata, preserve the design variables rather than extracting only the indicator column.
Match the indicator definition
Read the table notes. Confirm whether the statistic is a published TFR, an estimate from birth histories, a recent-birth measure, or a proxy such as children ever born. Do not treat fertility preference as observed fertility.
Align the reference period
Place the survey fieldwork dates and fertility reference periods in separate columns. A survey conducted in 2019–21 may report fertility for the three years before the survey, not for the calendar year 2020 as a whole.
Estimate uncertainty
Use published confidence intervals where available. For microdata, calculate design-based uncertainty. If no defensible uncertainty estimate can be produced, say so directly and moderate the claim.
Test sensitivity
Where geography is uncertain, calculate results under more than one plausible harmonisation. If the conclusion changes when a split district is aggregated differently, that sensitivity is itself an important result.
Write the limitation beside the finding
Do not hide the caveat in a final appendix. If a district comparison depends on an approximate boundary match, place that information next to the figure or paragraph where the comparison is interpreted.
The route from a number to a responsible conclusion
DLHS and NFHS are both indispensable to India’s reproductive and population-health evidence base. DLHS brought district-level maternal, child, family-planning, and reproductive-health conditions into sharper view across earlier survey rounds. NFHS expanded the breadth, recency, and district coverage of household and health measurement, especially in NFHS-4 and NFHS-5.
But the strength of these datasets lies in using them with discipline. A district estimate is not a census count. A shared indicator name does not prove a shared definition. A shared district name does not prove a shared boundary. And a numerical difference does not prove a demographic trend.
For practitioners, researchers, and policy analysts, the most reliable comparison is therefore not the one with the most decimal places. It is the one that makes the care pathway from source to conclusion easy to follow: which women were included, what period was measured, which district was represented, how the estimate was calculated, and how much uncertainty remains.
That is how district fertility analysis becomes useful beyond the spreadsheet. It can show where reproductive choices are changing, where services are failing to keep pace, and where a single rate conceals very different experiences for women and families. The task is not to choose DLHS or NFHS as a universal winner. It is to use each survey for the question it can genuinely answer—and to be honest when the data cannot support a stronger claim.