DLHS boundary changes: how to compare district data
A researcher pulls two datasets—DLHS-3 and DLHS-4—to track a maternal-health indicator across a decade. The files look comparable.
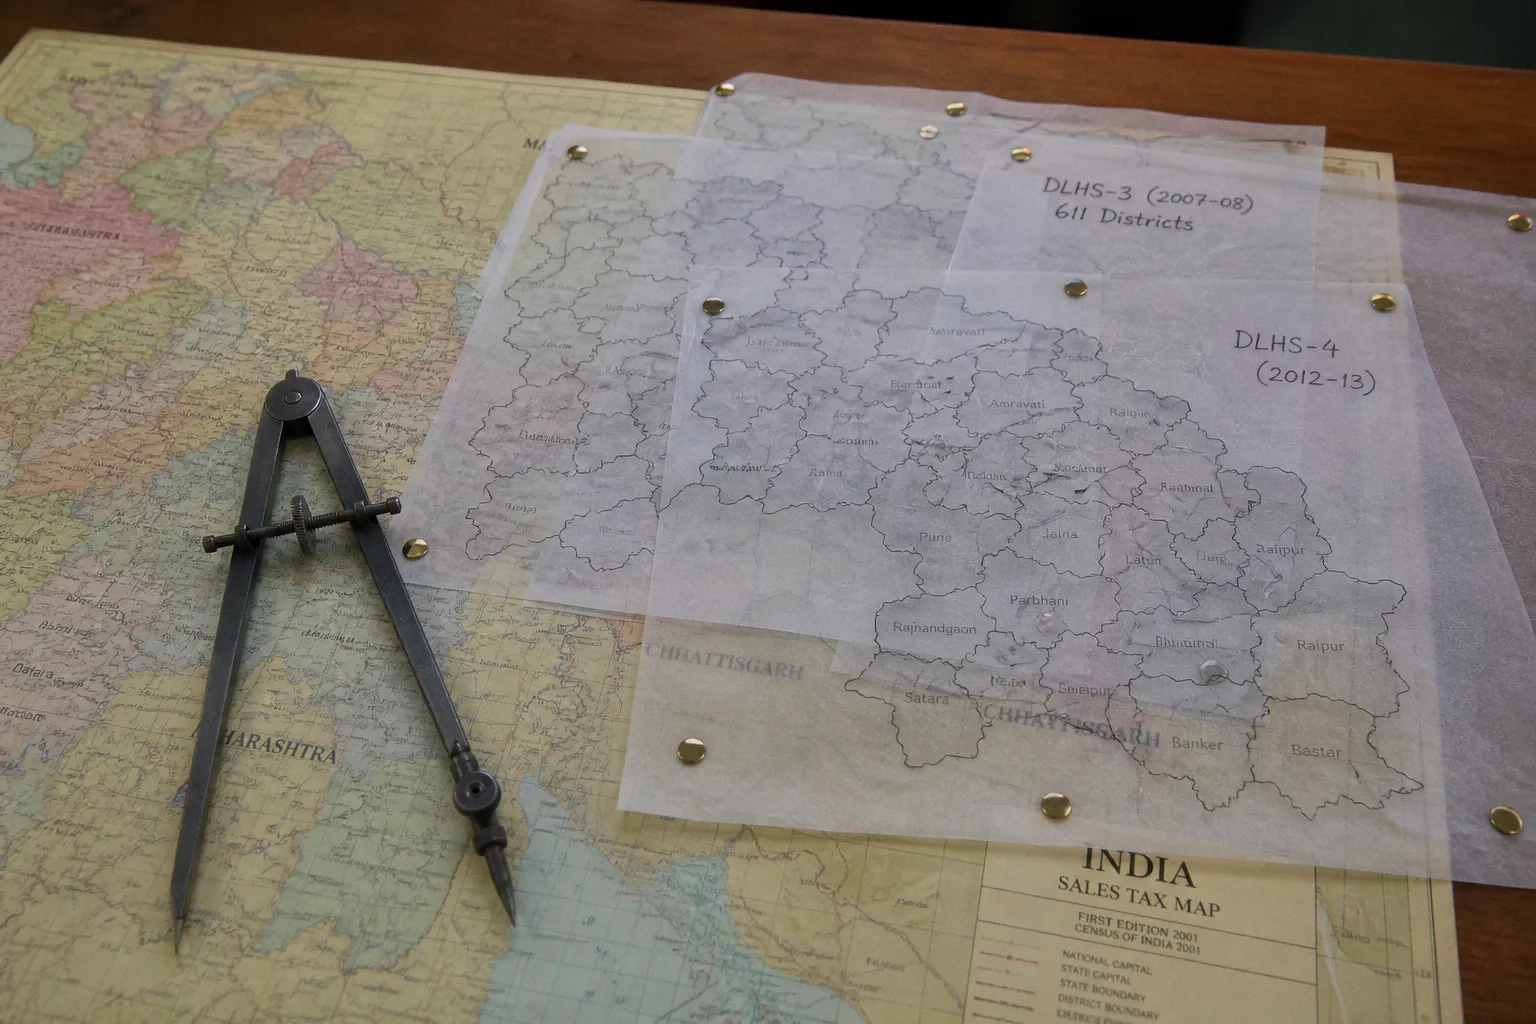
The years are close enough, the indicators appear familiar, and both surveys are associated with the same national research institution. Then the join returns nulls.
Nine states are absent from DLHS-4 altogether. Several district names in the 2007–08 file do not appear in the 2012–13 file because administrative units were split, renamed, or otherwise reorganized. A district-level trend that seemed straightforward has turned into a geography problem.
That problem is easy to miss because the files are usually approached as survey waves. In practice, DLHS-3 and DLHS-4 are separate cross-sectional snapshots. Their questionnaires and indicator families overlap, but their geographic frames do not line up automatically. A comparison therefore requires more than putting two columns next to each other. It requires deciding what the unit of comparison actually is.
Why DLHS-3 and DLHS-4 do not sit on the same map
DLHS-3 was conducted in 2007–08 and covered 611 districts across India, using the 2001 Census as its sampling frame. DLHS-4 was conducted in 2012–13, but it did not repeat the same nationwide district design. Nine states were excluded from the DLHS-4 frame and were instead covered through the Annual Health Survey (AHS), which ran three rounds between 2010 and 2013.
The nine excluded states were:
- Assam
- Bihar
- Chhattisgarh
- Jharkhand
- Madhya Pradesh
- Odisha
- Rajasthan
- Uttar Pradesh
- Uttarakhand
This is not a small technical footnote. It determines whether the second observation in a time comparison exists at all. For those states, there is no DLHS-4 district estimate to place directly beside the DLHS-3 estimate. The relevant endpoint has to come from AHS, and AHS is a separate survey programme with its own questionnaire, sampling design, field procedures, and documentation.
For the states that remain in the DLHS-4 frame, the comparison still needs geographic checking. The fact that a state appears in both rounds does not mean that every district is the same unit in both files.
DLHS-4 is not a smaller DLHS-3. It is a different survey frame, covering a different subset of India.
The most common error is to treat missing states as missing observations and proceed with the remaining records as though the national frame were unchanged. That produces a result that may be numerically clean but substantively misleading. A national or all-India trend can no longer be interpreted as a like-for-like continuation of DLHS-3 when the composition of the covered states has changed.
The first decision, then, is not statistical. It is geographic:
1. Is the analysis limited to states covered in both DLHS-3 and DLHS-4?
2. Does it include one or more of the nine states moved to AHS?
3. Is the intended unit a current district, a historical district, a state, or an aggregated region?
4. Can the two survey estimates be expressed on the same administrative frame?
Until those questions are answered, calculating a trend is premature.
The sampling frame is not frozen
The 2001 Census frame that anchored DLHS-3 was already several years old by the time DLHS-4 fieldwork took place. Administrative geography does not remain still during a survey interval. States create new districts, divide parent units, alter names, and revise the boundaries used by departments and statistical systems. Survey files inherit those changes unevenly.
The relevant issue for the 2007–08 to 2012–13 comparison is not a later reorganization that occurred after the second survey. Andhra Pradesh, for example, should not be used as a supposed illustration of a later district split during this period. The later reorganization associated with the creation of Telangana had not yet occurred in the DLHS-3 to DLHS-4 comparison window.
The safer description is more limited and more useful: in the intervening administrative cycle, some parent districts in states such as Madhya Pradesh, Uttar Pradesh, and Rajasthan were divided, renamed, or represented differently in administrative lists. That is enough to break a naïve name-based merge. It is not necessary to attach every later state reorganization to the earlier survey comparison.
In a district file, the consequences can look deceptively simple:
- A DLHS-3 record may refer to a parent district that was later divided into multiple administrative units.
- A DLHS-4 record may refer to a newer district that has no one-to-one counterpart in the earlier file.
- The same district may appear under a changed spelling, abbreviation, or official name.
- A code that looks stable may have been assigned under a different coding system.
- A current district list may contain units that did not exist in the historical survey frame.
A name match is therefore not evidence of geographic equivalence. It is only a starting point for investigation.
What a district crosswalk has to record
A usable crosswalk should not be a two-column table containing an old name and a new name. It should document the relationship between the units and the decision made for analysis. At minimum, each row should identify:
- the district name and code used in DLHS-3;
- the district name and code used in DLHS-4, where applicable;
- the state in both rounds;
- whether the unit is unchanged, split, merged, renamed, or unmatched;
- the effective administrative change, if it can be established;
- the source used to verify the relationship;
- the treatment adopted in the analysis.
The last field is the one most often omitted. A crosswalk is not only a description of geography. It is a record of analytical choices.
If one DLHS-3 district corresponds to several DLHS-4 districts, the analyst has several possible treatments. The parent unit can be reconstructed by aggregating the children, the affected district can be excluded from a strict like-for-like comparison, or the newer districts can be analysed as new units with a documented break in series. Each choice answers a different question.
Reconstructing a parent district is not as simple as adding percentages. If the underlying estimates have different denominators, the correct aggregation requires the relevant counts or defensible population weights. A district-level percentage calculated from several children should normally be built from the component numerators and denominators, not from an unweighted average of child percentages.
Where those inputs are unavailable, the limitation should be stated rather than hidden behind a neat-looking number.
What DLHS-3 measured at the district level
DLHS-3 was not a uniform sweep with exactly the same number of households in every district. The district sample generally fell in the range of roughly 1,000 to 1,500 households, with allocation informed by baseline maternal and child health performance from DLHS-2. Districts with weaker performance were given greater sampling attention so that district-level estimates could be produced with useful precision.
That design matters when comparing estimates across rounds. A district estimate is not only an indicator value; it is also the product of a sample design, a denominator, a weighting procedure, and a level of uncertainty.
Three practical consequences follow.
First, a large difference between two percentages does not automatically indicate a large real-world change. A district with a smaller effective sample or a less stable denominator may produce a wider interval around the estimate. Without the relevant uncertainty information, the apparent movement can be overstated.
Second, the allocation rules may not be identical between DLHS-3 and DLHS-4. It is not safe to assume that the same district received the same sample treatment in both rounds. The analyst should review the survey documentation and the district-level sample information before interpreting changes.
Third, the sampling frame and the administrative frame are related but not interchangeable. The 2001 Census supplied the basis for DLHS-3, while later survey work operated in a country where settlement classifications, district boundaries, and administrative listings had changed. A district label can therefore conceal a change in the population represented by the estimate.
This is why the DLHS-3 district-level fact sheets and survey documentation are not optional background reading. They contain the allocation logic and definitions needed to understand what a district estimate means. Microdata alone cannot answer every comparability question.
District comparison is not the same as indicator comparison
Geographic alignment is only one layer of the problem. Two records can refer to an apparently matching district while measuring different populations or behaviours.
For each indicator, compare:
- the wording of the question;
- the reference period;
- the age or eligibility criteria;
- the numerator;
- the denominator;
- the treatment of missing or unknown responses;
- the weighting and estimation procedure;
- whether the result is household-based, woman-based, child-based, or facility-based.
For example, an antenatal-care measure may differ depending on whether it refers to all currently married women, women with a recent birth, or a specified age group. An immunization indicator may use a child-age range or a reference source that differs between rounds. Institutional delivery may depend on the survey’s definition of a facility and the eligible birth period.
The label in a table is not enough. A variable called “institutional delivery” in one file is not automatically identical to a variable with the same label in another.
The Annual Health Survey is a substitute, not a replacement
For the nine states excluded from DLHS-4, the Annual Health Survey provides the relevant district-level endpoint during the 2010–13 period. That makes AHS an important source for comparative work, but it does not turn AHS into DLHS-4.
The surveys share broad indicator families, including antenatal care, immunization, institutional delivery, and family planning. Shared subject matter is not the same as shared measurement. The surveys may differ in questionnaire wording, sample design, field protocol, reference period, denominator, and reporting conventions.
A comparison for an excluded state therefore has a different structure:
- DLHS-3 provides the 2007–08 baseline.
- AHS Round 2 or Round 3 may provide the later observation, depending on the period and indicator required.
- The analyst must establish whether the selected AHS variable measures the same construct as the DLHS-3 variable.
- The result must be described as a cross-survey comparison, not as a direct DLHS-3-to-DLHS-4 trend.
Some indicators may be sufficiently aligned for a carefully qualified comparison. Others may require harmonization, a restricted denominator, or complete exclusion from the trend analysis. The fact that two values are available for the same district does not resolve that question.
AHS is a parallel rail, not a continuation of the same track. Treat it accordingly.
| Parameter | DLHS-3 (2007–08) | DLHS-4 (2012–13) | AHS, 2010–13 |
|---|---|---|---|
| Geographic coverage | 611 districts across India | Excludes Assam, Bihar, Chhattisgarh, Jharkhand, Madhya Pradesh, Odisha, Rajasthan, Uttar Pradesh, and Uttarakhand | Covers the states excluded from DLHS-4 |
| Survey role | District-level baseline for the DLHS-3 round | Later DLHS round for the states in its frame | Alternative later source for the nine excluded states |
| Sampling frame | Anchored to the 2001 Census | A later survey frame with a different state coverage pattern | AHS-specific frame and design |
| District sample | Commonly around 1,000–1,500 households, with allocation variation | Varies by survey and state design | Varies by state and round |
| Measurement | DLHS-3 questionnaire and field protocol | DLHS-4 questionnaire and field protocol | AHS questionnaire and field protocol |
The table is useful precisely because it prevents a category error. For the nine excluded states, the analyst is not comparing two DLHS waves. The analyst is comparing a DLHS observation with an AHS observation and must account for the instrument change.
A practical workflow for comparing rounds
A defensible comparison usually takes more preparation than the final calculation. The following sequence keeps the geographic and measurement decisions visible.
1. Fix the analytical geography
Decide whether the study concerns states, districts, divisions, or another aggregate. District-level comparisons are the most demanding because they are exposed to boundary changes and often carry the widest uncertainty.
If the substantive question can be answered at state level, aggregation may reduce the number of boundary problems. It does not eliminate survey-design differences, but it can make the geographic frame more stable. If the question is specifically about districts, the study should accept the additional documentation burden rather than quietly treating current districts as historical ones.
2. Separate the nine-state problem from the boundary problem
Create the state inclusion list before examining district names. Mark the nine states excluded from DLHS-4. For those states, define the comparison as DLHS-3 plus AHS, or exclude them from a DLHS-3 versus DLHS-4 analysis.
Do not mix the two comparisons in one headline trend without making the change of instrument explicit. A national series that combines DLHS-4 for some states with AHS for others may be possible for a specific purpose, but it is not a single-h instrument trend. It requires a harmonization argument and transparent reporting.
3. Reconstruct the historical district lists
Use district lists appropriate to each survey period rather than a current administrative map. Official census material, survey documentation, and state administrative records are preferable to crowd-sourced lists because the question is not merely what a district is called today. The question is which population and boundaries the survey treated as the district at the time.
Keep the original spellings and codes in the working file. Add standardized names as separate fields instead of overwriting the source values. That makes it possible to audit every match.
4. Classify each district relationship
Each district pair should receive a relationship type:
- unchanged or substantially corresponding;
- renamed or spelling-adjusted;
- split from an earlier parent;
- merged with another unit;
- newly created;
- not found or unresolved.
An unresolved match should remain unresolved until supported by a source or spatial evidence. Forcing every record into a match creates false continuity.
5. Choose a treatment for splits and merges
There is no universally correct treatment. The right choice depends on the estimand.
If the question is whether the historical parent district improved, reconstructing the parent from its later children may be appropriate. If the question concerns the districts as administrative units, the split may need to be treated as a break in series. If reliable weights or component counts are unavailable, exclusion may be more defensible than a synthetic reconstruction.
Document the rule before looking at the results. Otherwise, the treatment can become an unnoticed response to whether a particular district makes the trend look stronger or weaker.
6. Compare definitions before comparing values
Place the DLHS-3 and DLHS-4 questionnaires, codebooks, and indicator tables side by side. For AHS comparisons, add the relevant AHS documentation to the same review.
Record the definition used for each indicator in a harmonization table. The table need not appear in full in the published article, but the analysis should preserve it. A short note that two indicators were “matched” is not enough when their denominators or reference periods differ.
7. Inspect sample sizes and uncertainty
Compare district-level sample allocations, denominators, weights, and available measures of uncertainty. Avoid treating a fixed threshold—such as a particular percentage difference in sample size—as a universal decision rule. The relevant concern is whether the change in design or precision affects the interpretation of the estimate.
A district with similar nominal sample sizes can still have different effective precision if the eligible population, response pattern, weighting, or clustering differs. Conversely, a changed sample allocation may not invalidate a comparison if the estimates are properly weighted and their uncertainty is reported.
8. Run a boundary sensitivity analysis
Estimate the result for the full harmonized set and then repeat it after excluding districts affected by splits, mergers, uncertain matches, or major boundary changes. The purpose is not to choose whichever version is more favourable. It is to show whether the headline conclusion depends on fragile geographic matches.
If the direction or size of the change moves materially after affected districts are removed, that should be part of the finding. It indicates that administrative geography is contributing to the result.
What should appear in the methods note
A reader should be able to tell how the geography was handled without reconstructing the entire project from raw files. A concise methods note should state:
- which states were included in each survey comparison;
- whether the nine DLHS-4-excluded states were removed or analysed with AHS;
- which historical district lists were used;
- how names and codes were standardized;
- how splits, mergers, renamings, and unresolved units were treated;
- whether parent districts were reconstructed;
- which population or survey weights were used for aggregation;
- how indicator definitions were reconciled;
- how uncertainty was assessed;
- whether a sensitivity analysis changed the result.
This is not bureaucratic padding. In district-level health analysis, the geographic decision can change the estimand. A methods appendix is where that decision becomes inspectable.
The same principle applies to maps. A current administrative map overlaid with historical survey values can create an attractive figure while implying a geographic precision the data do not possess. If the map uses present-day boundaries, label it as a display transformation and explain how historical units were assigned. Do not let the map suggest that a 2007–08 value was collected from a district boundary that only appeared later.
Common shortcuts that fail
Several shortcuts recur because they produce a result quickly.
Matching on district names alone
This fails when names change, when spelling varies, and when a parent district is replaced by several children. It also fails silently: the unmatched records disappear, while the matched records look authoritative.
Using the current district list for both rounds
A current list is useful for present-day reporting but not automatically valid for historical comparison. It can make newly created districts appear to have earlier observations or assign an old estimate to a geographic unit that did not exist at the time.
Averaging district percentages
An unweighted average gives a small district the same influence as a large one and can misrepresent an aggregate indicator. Where aggregation is justified, use compatible numerators and denominators or documented weights.
Treating AHS as DLHS-4 by another name
AHS can supply a later observation for the states outside the DLHS-4 frame. It does not erase the difference between the surveys. The source and instrument must remain visible in the analysis and in the prose.
Assuming identical indicator labels mean identical variables
Labels are shorthand. Definitions determine comparability. A one-word difference in the reference period or denominator can matter more than a one-year difference between survey rounds.
Reporting a trend without a frame note
A percentage change without a geographic note encourages the reader to interpret the result as population change when it may partly reflect coverage change or boundary change. The frame belongs next to the result, not buried in a technical appendix.
Where this leaves the comparison
DLHS-3 and DLHS-4 are frequently used together in district-level health analysis because they sit at opposite ends of an important period and contain overlapping families of indicators. That usefulness does not make them a continuous panel. The nine-state exclusion, the changing sampling frame, administrative reorganizations, and the absence of a universal district crosswalk all create breaks that must be handled explicitly.
For states included in both rounds, DLHS-3 and DLHS-4 can support a comparison after the district geography and indicator definitions have been checked. The result should be framed as a comparison of survey rounds, not as an automatic longitudinal record for every named district.
For Assam, Bihar, Chhattisgarh, Jharkhand, Madhya Pradesh, Odisha, Rajasthan, Uttar Pradesh, and Uttarakhand, the later source is AHS rather than DLHS-4. Any trend should identify that instrument change and establish indicator-level comparability before presenting the values as movement over time.
For districts affected by splits, mergers, renamings, or unresolved boundary relationships, the analysis must choose between reconstruction, exclusion, or a documented break in series. None of these choices is cost-free. The defensible choice is the one that matches the research question and remains visible to the reader.
The repair is not to add another merge command. It is to establish the frame first, build the crosswalk second, reconcile the indicators third, and test the result against the districts whose geography changed. Only then does a difference between DLHS-3 and DLHS-4 become evidence of a health change rather than a side effect of how India’s administrative map was redrawn.